
St. Stephen Fish Lift
1987 - 2014 Graphs of Blueback herring and American shad
that have passed through the St. Stephen's Fish Lift
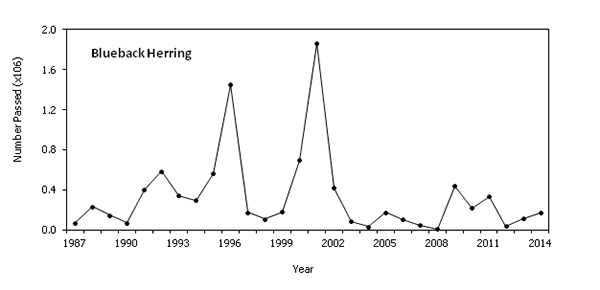
Figure 1. Y –axis represent the amount of Blueback herring passing during the year. 0.4 =400,000, 0.8=800,000, 1.2= 1,200,000, 1.6=1,600,000, 2.0= 2,000,000.
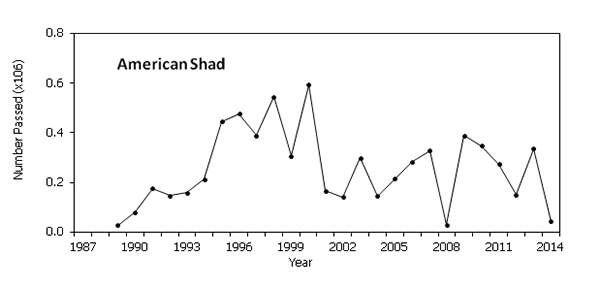
Figure 2. Y-axis represents the amount of American Shad passing during the year. 0.2=200,000 0.4=400,000, 0.6=600,000, 0.8=800,000.
Fish passage through St. Stephen Fish Lift is variable from year-to-year. This variability is due to environmental factors (the amount of river flow, water temperature, and natural variations in population numbers) and man-made factors (construction and maintenance of the mechanics of the fish lift). From 2012-2014, the operating season was shortened due to major rehabilitation of the hydraulics and structural components of the Fish Lift.
Biologists use multi-year trends and averages to assess anadromous fish runs at St. Stephen Fish Lift to account for the many factors that affect fish passage.