Marine - Species - Spotted Seatrout
Fishery Status

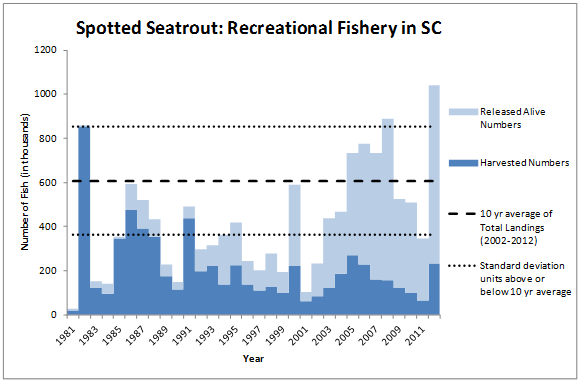
Recreational total catch showed a general declining trend from 1986 through 1999. Spotted seatrout are susceptible to over-wintering mortality during colder than average winters. This can result in decreased catches the following year and was responsible for drops in catch that occurred in 1990, 2001, and 2011. One other notable trend is the increase in fish released alive from 2003-2012. The most severe winter kill occurred in 2000-2001 and it took almost five years for recreational catches to reach the 10 year average catch (607,641 fish per year.
There are no commercial landings of spotted seatrout in South Carolina due to their status as a gamefish since the 1980's.
The recreational catch data is provided by the National Marine Fisheries Service (NMFS), which conducts phone and angler-intercept surveys to monitor angler activities and catches. For more information see: https://www.st.nmfs.noaa.gov/.
The commercial fisheries data is provided by the National Marine Fisheries Service (NMFS), which compiles commercial information provided by state agencies. For more information, see: https://www.st.nmfs.noaa.gov/.
Additional Graph Information
Commercial and recreational catches are measured in number of individuals or pounds of fish caught. Changes in catch among years may be the result of changes in abundance, fishing effort, or a combination of the two
On each graph, the horizontal dotted lines above or below the "10 year average" represent one "standard deviation" unit, which is a measure of how variable the annual data are around the 10-year average. In general, the area between one standard deviation above the mean and one standard deviation below the mean includes approximately 68% of all values. Approximately 95% of observations in the data set are found within two standard deviation units of the average and is referred to as the prediction interval.
