
Marine - Species - Blue Crab
Abundance of Species
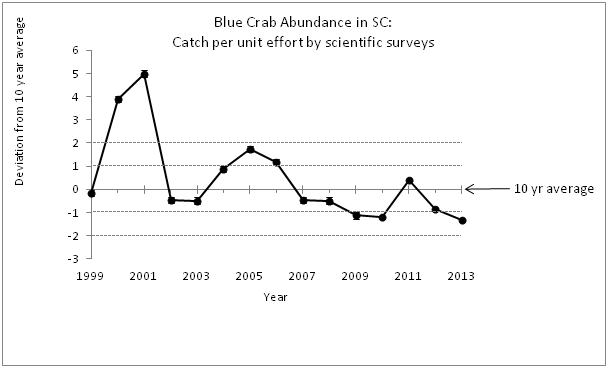
DNR surveys collected low numbers of blue crabs in 2013, similar to numbers observed in 2007-2010. The population continues to be in an apparent decline, begun during and after the long-term drought of 1998-2002. Although significantly more rainfall occurred in 2013, overall numbers of blue crab have not recovered in recent years, due possibly to changing climatic conditions and fishing pressure. Data used in the associated graph were derived from DNR's inshore crustacean survey and SCECAP projects. A negative value indicates that the catch per unit effort (CPUE) of blue crabs was lower than the 10 year mean, while a positive value indicates that the CPUE was higher than the 10 year mean.
Additional Graph Information
Graphs of abundance show relative annual abundance in South Carolina waters based on surveys conducted by the SC Department of Natural Resources.
Abundance is presented relative to the average of the 10 most recent years. Unlike graphs of the recreational and commercial fisheries catch, the abundance graphs use survey data that have been standardized to allow direct comparison among years.
The horizontal dotted lines above or below the "10 year average" represent one "standard deviation" unit, which is a measure of how variable the annual data are around the 10-year average. In general, the area between one standard deviation above the mean and one standard deviation below the average includes approximately 68% of the values. Approximately 95% percent of observations in the data set are found within two standard deviations of the average.