
Wildlife - Wild Turkeys
2021 Wild Turkey Summer Survey
WILD TURKEY REPRODUCTION AT HIGHEST LEVEL IN A DECADE
Annually since the early 1980’s, the S.C. Department of Natural Resources (SCDNR) has conducted a Summer Turkey Survey to estimate reproduction and recruitment of wild turkeys in South Carolina. The survey involves agency wildlife biologists, technicians, and game wardens, as well as many volunteers from other natural resource agencies and the general public. This year approximately 210 participants recorded 1,126 unique observations, seeing approximately 7,300 turkeys across the state in July and August. Although wild turkeys nest primarily in April and May in South Carolina, the survey does not take place until late summer. Therefore, the survey statistics document poults (young turkeys) that survived and entered the fall population (Table 1).
Wild turkey productivity is assessed by observations of reproduction and associated survival of offspring being recruited into the population. This measure of young entering the population based on the number of hens in the population is the Total Recruitment Ratio (TRR). This annual index is the most practical measure of productivity because it considers successful hens, unsuccessful hens, and poult survival. Recruitment of four or more poults per hen is considered excellent, three is good, two is fair and considered a break-even point, and one or less poults per hen is poor. If hens are successful at some level, a turkey population can be maintained. However, the goal is to optimize conditions through management applications to promote optimal reproductive success and turkey populations that provide sustainable, quality turkey hunting opportunities into the future. Unlike deer, wild turkeys are much more susceptible to significant fluctuations in reproduction and recruitment. Lack of reproductive success is often associated with bad weather (cold and wet) during nesting and brood rearing season. However, there are a host of predators that take advantage of turkey nests and broods including: raccoons, opossums, skunks, armadillos, snakes, foxes, coyotes, bobcats, feral hogs, and numerous avian predators including hawks, owls, and crows.
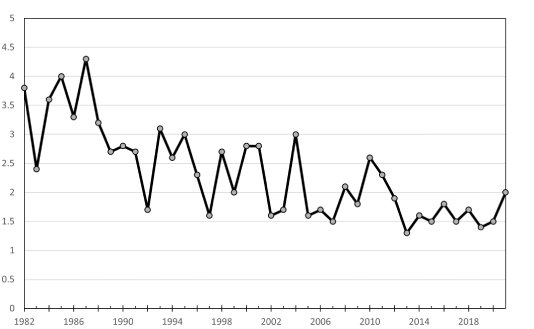
South Carolina has experienced declines in turkey productivity since 1988. Average recruitment prior to 1988 was 3.5 poults per hen. Average recruitment since 1988 has been 2.1, representing a 40 percent decrease in average recruitment. Coincidentally, the turkey harvest has decreased over 40 percent since it peaked in 2002. This has been a slow and steady decline with TRR numbers in the 1990’s averaging 2.5, but since 2005 numbers below 2.0 have been the norm with an average TRR the last 15 years of 1.8 (Figure 2). This year’s statewide TRR was 2.0, the highest it has been since 2011. For hens that successfully raise a brood, average brood sizes of 3.5 to 4 poults have remained consistent over time. However, the driving factor in the low productivity is the high percentage of hens that have no poults at all by late summer. Fifty (50) percent of hens observed this summer had no poults and that figure has averaged 56% the last five years (Table 2). Hens without poults are considered unsuccessful and either did not attempt to nest, abandoned their nest, lost their nest to predation or human disturbance, or had no poults survive due to predation, exposure, starvation, disease, or flooding. Fifty percent unsuccessful hens this year is also the lowest percentage observed since 2011 (46%).
Survey results this year are encouraging, and a bright spot given recent trends, but it is important to note that the statewide average TRR of 2.0 is considered a break-even point where reproduction is likely only replacing loses to hunting and non-hunting mortality and the population is not growing. The Piedmont-Mountain region had the best reproduction in the state this year (2.3 TRR) and the greatest improvement over dismal numbers in 2020 (1.2 TRR). The Northern Coastal Plain region of the state was also noteworthy, with a recruitment ratio of 2.1 and significant improvement over the 1.3 figure of 2020 (Table 1).
While this year’s results are an improvement, TRR figures consistently below 2.0 over the last decade have led to a decreasing population as reflected by decreasing harvest trends. It is worth noting that turkeys have high reproductive potential and are normally able to maintain populations despite predation and weather-related factors. Predators and periodic poor weather conditions existed prior to the year 2000 so this more recent and prolonged poor success may be tied to a high number of hens that did not breed successfully or poor fitness, vigor, and survival of poults due to genetics, disease, other environmental factors, or large-scale changes in habitat.
The intent of legislative changes which took effect in 2020 that adjusted starting dates, season length, bag limits and limited the gobbler harvest during the first 10 days of the season, was to increase turkey populations by improving reproductive success. Although reproduction in 2021 was the best in a decade, at this point it is not indicative of a cause-and-effect relationship with the changes. However, it was the intent of the legislation and continued improvement over the next few years will lend credence to drawing that conclusion. Continued research, survey and attention to season timing, bag limits and other potential contributing factors is warranted.
It is also worth noting that both short and long-term fluctuations in numbers are not unexpected given the reproductive strategy of turkeys and the multiple factors that influence their success and survival. This inherent instability is the reason annual monitoring is critical for this species.
Anyone interested in participating in the annual Summer Turkey Survey is encouraged to sign-up. The survey period is July 1-August 29 annually and those who participate typically spend a reasonable amount of time outdoors during that period. Cooperators obviously must be able to identify wild turkeys and must be comfortable in telling the difference between hens, poults, and gobblers. If you would like to participate in the survey, contact Jay Cantrell at cantrellj@dnr.sc.gov. You will be added to the cooperator list and receive materials at the end of June annually. Those interested in the survey can also download instructions and survey forms at the following website: https://www.dnr.sc.gov/wildlife/turkey/volunbroodsurvey.html.
Figure 1. Map of physiographic regions for 2021 Summer Turkey Survey.

Table 1. Summary of reproductive data for 2021 Summer Turkey Survey by region.
Region | Gobbler Hen Ratio |
No. Hens w/Poults |
No. Hens w/o Poults (%) |
No. Poults |
Avg. Brood Size |
Total Recruitment Ratio |
|---|---|---|---|---|---|---|
Piedmont & Mtns |
0.42 |
409 |
325 (44) |
1692 |
4.1 |
2.3 |
Midlands |
0.73 |
159 |
233 (59) |
706 |
4.4 |
1.8 |
Northern |
0.50 |
191 |
168 (47) |
746 |
3.9 |
2.1 |
Southern |
0.59 |
217 |
252 (54) |
822 |
3.8 |
1.8 |
Statewide |
0.54 |
976 |
978 (50) |
3966 |
4.1 |
2.0 |
Table 2. Statewide Summer Turkey Survey reproductive data 2017-2021
Year |
Gobbler Hen Ratio |
No. Hens w/Poults |
No. Hens w/o Poults (%) |
No. Poults |
Avg. Brood Size |
Total Recruitment Ratio |
|---|---|---|---|---|---|---|
2017 |
0.58 |
1,409 |
1,737 (55) |
4,832 |
3.4 |
1.5 |
2018 |
0.62 |
1,076 |
1,206 (53) |
3,948 |
3.7 |
1.7 |
2019 |
0.62 |
728 |
1,173 (62) |
2,670 |
3.7 |
1.4 |
2020 |
0.54 |
807 |
1,225 (60) |
2,971 |
3.7 |
1.5 |
2021 |
0.54 |
976 |
978 (53) |
3,966 |
4.1 |
2.0 |
Average |
0.58 |
999 |
1,264 (56) |
3,677 |
3.72 |
1.6 |
Figure 2. Summer wild turkey recruitment ratio in South Carolina 1982-2021.
The 2021 Summer Turkey Brood Survey above is provided in Adobe® Acrobat® (PDF) format. Adobe® Reader® is required to open this file and is available as a free download from the Adobe® Web site.