
| Section | Section | Section | Section |
|---|---|---|---|
| Climate Controls | Temperature | Precipitation | Severe Weather |
| Tropical Cyclones | Drought | Floods | Winds |
| Evaporation | Bibliography |
1991-2020 South Carolina Climate Normals* Contour Maps
Annual and Seasonal Maps
| Annual | Spring | Summer | Fall | Winter |
|---|---|---|---|---|
| Max. T | Max. T | Max. T | Max. T | Max. T |
| Avg. T | Avg. T | Avg. T | Avg. T | Avg. T |
| Min. T | Min. T | Min. T | Min. T | Min. T |
| Rain | Rain | Rain | Rain | Rain |
Monthly Maps
| JAN | FEB | MAR | APR | MAY | JUN | JUL | AUG | SEP | OCT | NOV | DEC |
|---|---|---|---|---|---|---|---|---|---|---|---|
| MAX. T | MAX. T | MAX. T | MAX. T | MAX. T | MAX. T | MAX. T | MAX. T | MAX. T | MAX. T | MAX. T | MAX. T |
| AVG. T | AVG. T | AVG. T | AVG. T | AVG. T | AVG. T | AVG. T | AVG. T | AVG. T | AVG. T | AVG. T | AVG. T |
| MIN T | MIN. T | MIN. T | MIN. T | MIN. T | MIN. T | MIN. T | MIN. T | MIN. T | MIN. T | MIN. T | MIN. T |
| Rain | Rain | Rain | Rain | Rain | Rain | Rain | Rain | Rain | Rain | Rain | Rain |
1991-2020 South Carolina Climate Normals Information
Climate normals are 30-year averages of climate data (i.e., temperature and precipitation) used to show typical climate conditions for a given location. Climate normals are updated every ten years to provide information on observed climate conditions. In May 2021, the National Centers for Environmental Information (NCEI) within National Oceanic and Atmospheric Administration (NOAA) released the most current climate normals, using quality-controlled data from 1991-2020. To learn more about climate normals, use the link provided below.
The 1991-2020 climate normals update included over 100 stations within South Carolina. Use the link below to explore the 1991-2020 normals station data for South Carolina.
South Carolina Stations: 1991-2020 Climate Normals Data
The South Carolina State Climatology Office has updated climate normals maps for the state based on the available data. The 1991-2020 climate normals maps for South Carolina include average temperature, maximum temperature, minimum temperature, and precipitation for three different timeframes: annual, seasonal, and monthly.
Disclaimer: These maps were created using NCEI’s 1991-2020 normals gridded dataset. The gridded dataset allows for "smoothing" between stations since stations are not equally distributed across South Carolina. This approach puts more emphasis on each grid point in the dataset rather than station values. Therefore, the maps capture more broadscale climate conditions, showing general conditions across the state. There may be some slight differences between the maps and specific station values. Use the station-specific dataset to investigate the new climate normals for a specific location close to a station. When analyzing the new climate normal for a particular location that is not close to a station, use the maps. The maps should also be used when investigating climate conditions for large areas, such as regions of the state or river basins.
Several factors control the climate. Most important are the state's location in the northern mid-latitudes, its proximity to both the Atlantic Ocean and the Appalachian Mountains, and elevation.
The state's position on the eastern coast of a continent is important because land and water heat and cool at different rates. This provides for cooling sea breezes during the summer and warms the immediate coast during the winter. Also, it influences the way pressure and wind systems affect the state. During the summer, South Carolina's weather is dominated by a maritime tropical air mass known as the Bermuda high. Passing over the Gulf Stream, it brings warm, moist air inland from the ocean. As the air comes inland, it rises and forms localized thunderstorms, resulting in a precipitation maxima (Trewarhta,1981).
The Appalachian Mountains also exert a major influence on the state's climate in three ways. First, they tend to block many of the cold air masses arriving from the northwest, thus making the winters somewhat milder. Second, the occurrence of downslope winds, which warm the air by compression, cause the areas leeward of the mountains to experience slightly higher temperatures than the surrounding areas. Hence, the proximity of the mountains to the state results in a more temperate climate than otherwise would be experienced. Lastly, the mountains cause a leeside rain shadow, an area of decreased, precipitation across the Midlands, roughly parallel to the fall line (Kronberg, 1959, Landers, 1970, and Purvis et al., 1990).
The state's annual average temperature varies from the mid-50's in the Mountains to low-60's along the coast. During the winter, average temperatures range from the mid-30's in the Mountains to low-50's in the Lowcountry. During summer, average temperatures range from the upper 60's in the Mountains to the mid-70's in the Lowcountry.
Monthly Climatic Data for South Carolina - 1971-2000 (pdf).
Precipitation is ample and distributed with two maxima and two minima throughout the year (Trewartha,1981). The maxima occur during March and July; the minima occur during May and November. There is no wet or dry season; only relatively heavy precipitation periods or light precipitation periods. No month averages less than two inches of precipitation anywhere in South Carolina. In northwestern South Carolina, winter precipitation is greater than summer; the reverse is true for the remainder of the state. During summer and early fall of most years, the state is affected by one or more tropical storms or hurricanes.
Average annual precipitation is heaviest in northwestern South Carolina, and annual totals vary directly with elevation, soil type, and vegetation. In the Mountains, between 70 to 80 inches of rainfall occur at the highest elevations, with the highest annual total at Caesars Head (79.29"). Across the Foothills, average annual precipitation ranges from 60 to more than 70 inches. In the eastern and southern portions of the Piedmont, the average annual rainfall ranges from 45 to 50 inches. The driest portion of the state, on the average, is the Midlands, where annual totals are mostly between 42 to 47 inches. Precipitation amounts are a little higher across the Coastal Plain. A secondary statewide maximum occurs parallel to the coast and about 10 to 20 miles inland. This maxima is a result of the sea-breeze front thunderstorms prevalent during summer. In the Coastal Plain, rainfall averages 50 to 52 inches.
The annual number of days of precipitation greater than or equal to 1 inch varies with elevation, with amounts of more than 24 in the Upstate to less than 12 in the Midlands. The annual number of days of precipitation greater than or equal to 0.1 inch varies from 95 in the Upstate to less than 70 in a portion of the Midlands. The annual number of days of precipitation greater than or equal to 0.5 inch varies from 48 in the Upstate to less than 30 in a portion of the Midlands.
Monthly Climatic Data for South Carolina - 1971-2000 (pdf).Wintry precipitation (snow, sleet, and freezing rain) also affect South Carolina. Snow and sleet may occur separately, together, or mixed with rain during the winter months from November to March, although snow has occurred as late as May in the mountains. Measurable snowfall may occur from one to three times in a winter in all areas except the Lowcountry, where snowfall occurs on average once every three years. Accumulations seldom remain very long on the ground except in the mountains.
Typically, snowfall occurs when a mid-latitude cyclone moves northeastward along or just off the coast. Snow usually occurs about 150 to 200 miles inland from the center of the cyclone. The greatest snowfall in a 24-hour period was 24 inches at Rimini in February 1973. During December 1989 Charleston experienced its first white Christmas on record, and other coastal locations had more than six inches of snow on the ground for several days following. Map 1 shows the annual distribution of snow across the state.
Sleet and freezing rain vary from 3.75 events per year in Chesterfield County to less than 0.75 events per year in the Lowcountry. The highest frequency by month occurs in January with more than 1.5 events per year in the Charlotte area and Chesterfield County, to less than 0.25 events per year in the Lowcountry (Davis and Gray, 1993). This rain, which freezes on contact with the ground and other objects, can cause hazardous driving conditions, breakage of various types of wires and the poles on which they are strung. One of the most severe cases of ice accumulation from freezing rain took place February 1969 in several Piedmont and Midlands counties. Timber losses were tremendous and power and telephone services were seriously disrupted over a large area (Landers, 1970).
Record 24 Hour Snowfall by County.
Severe weather occurs in South Carolina occasionally in the form of violent thunderstorms and tornadoes. Although less frequent than surrounding states, thunderstorms are common in the summer months. The more violent storms generally accompany squall lines and active cold fronts of late-winter or spring. Strong thunderstorms usually bring high winds, hail, considerable lightning, and rarely spawn a tornado.
Hail occurs infrequently, falling most often during spring thunderstorms from March through May. The incidence of hail varies from 1 to 1.5 hail days per year in the Midlands, Piedmont, and Foothills to 0.5 days per year in the Lowcountry (Coffey, 1988). Although hail can occur in every month during the year, May has the highest incidence with an average of more than 5 events per year. Typically, it occurs during the late afternoon and early evening between the hours of 3:00 p.m. and 8:00 p.m. (Knupp, 1992).
Tornadoes in the United States are observed in every state. South Carolina ranks 23rd in the United States for annual tornado frequency during the period 2000-2019 (Figure 1).
In the period from 1950 through 2019 South Carolina saw 1037 confirmed tornadoes, an average of 14 tornadoes per year (Figure 2). From 1994 to 2019 the annual average was 25 tornadoes per year. This dramatic increase is primarily attributable to the implementation of the National Weather Service's advanced NEXRAD Doppler radar system which is able to pinpoint tornadic vortex signatures State-wide, unlike previous NWS radar systems.
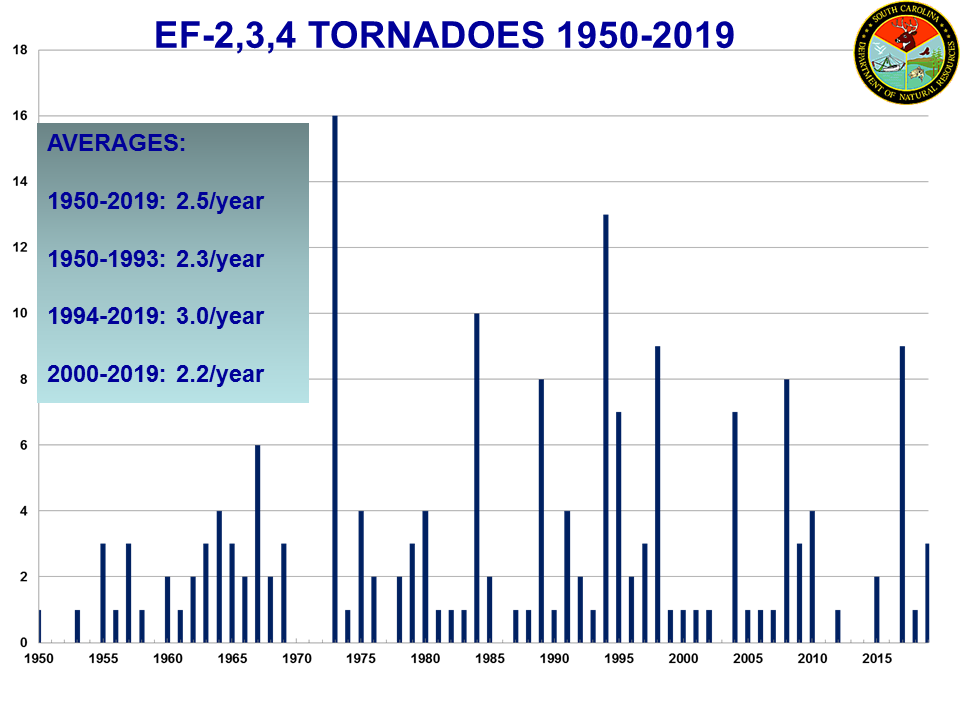
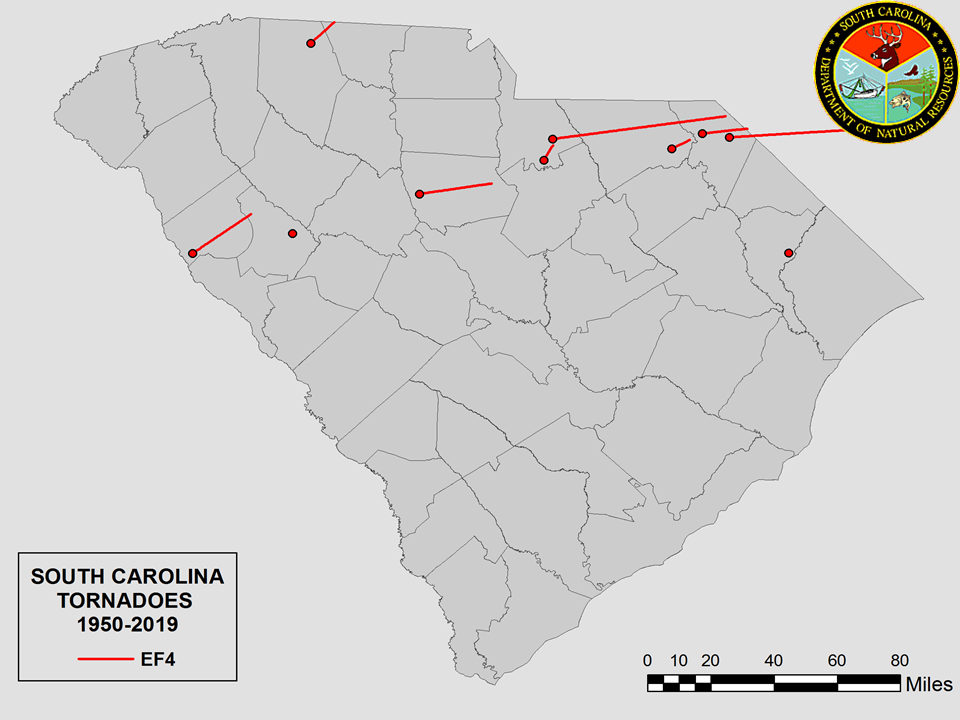
The majority of South Carolina's tornadoes are short-lived EF-0 and EF-1 tornadoes (Figure 3), the lowest tornado strengths on the Enhanced Fujita scale. These tornadoes with estimated wind speeds between 65 and 110 miles per hour usually cause only minimal damage and injuries. Stronger more destructive tornadoes are rare, but do occur with a consistent annual frequency of 2-4 per year (Figure 4). Destructive EF-4 tornadoes have touched down in South Carolina with wind speed of 166-200 miles per hour. There is no record or evidence of an EF-5 tornado, the strongest and most devastating on the EF scale, ever touching down in South Carolina.
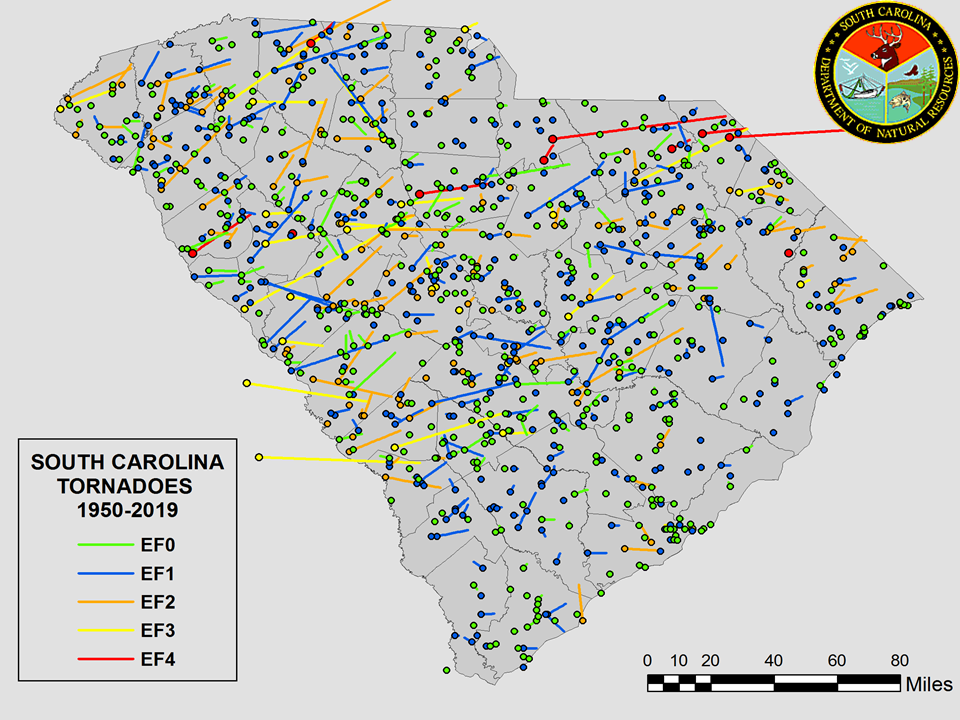
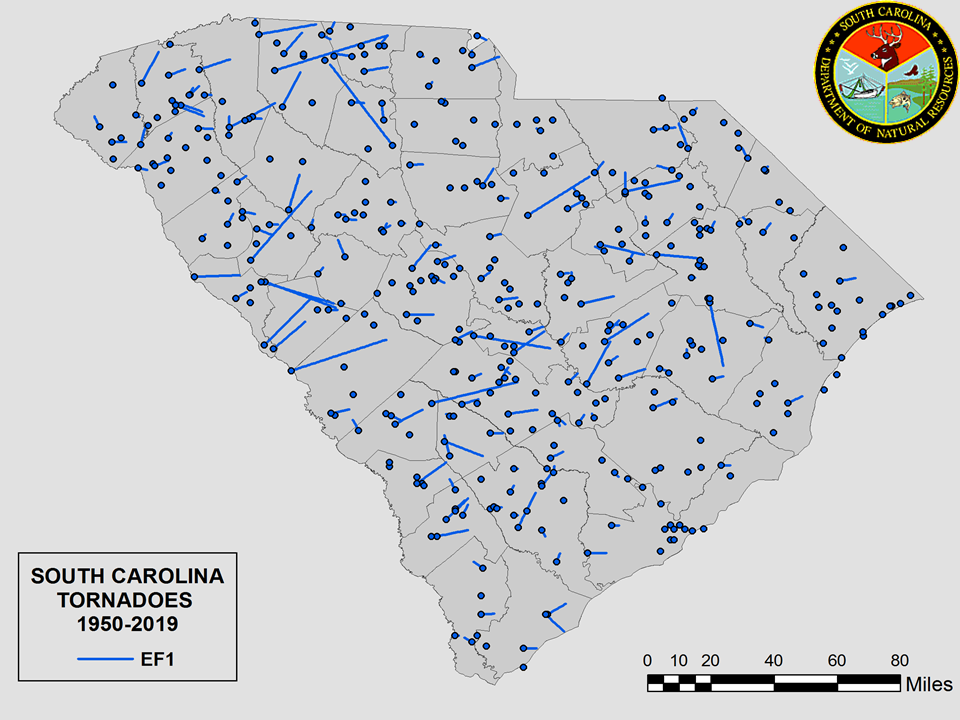
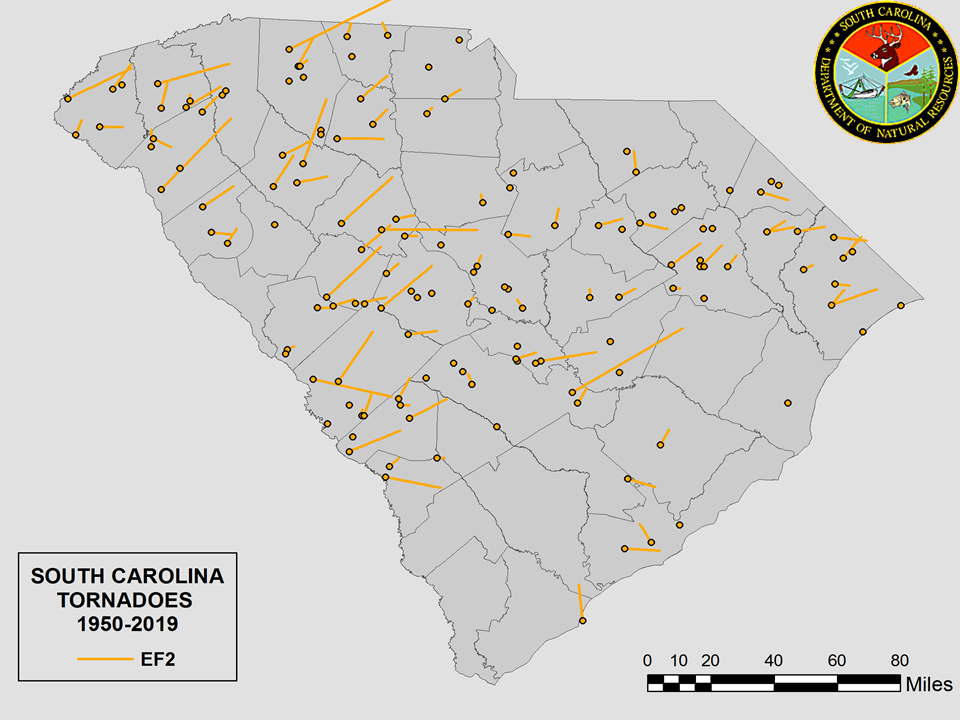
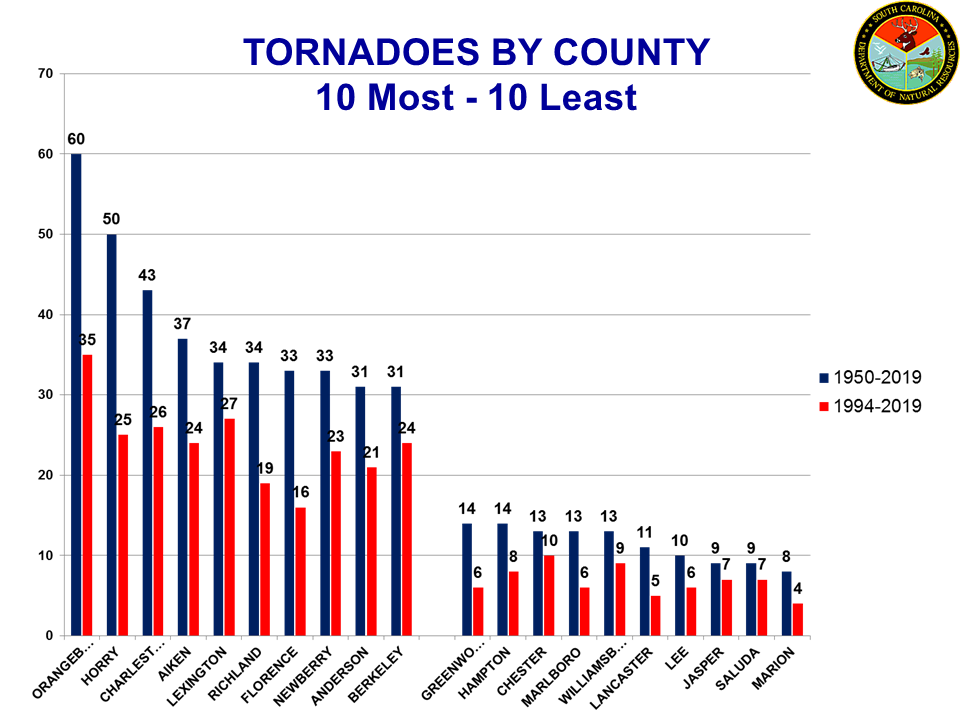
Figure 5 shows the distribution of all tornado touchdowns across the State and the tracks of longer-lived tornadoes. Figures 5a-e map separate EF0, EF1, EF2, EF3, and EF4 touchdowns and tracks. Tornadoes have touched down in every South Carolina County with the most frequent touchdowns and tracks in the Midlands and Pee Dee regions. The average tornado track is three to four miles long and 110 yards wide. The longest track in recent history was 62 miles long and 400 yards wide through McCormick, Edgefield and Saluda Counties in 1992. The widest track was caused by an EF-4 tornado that created a damage swath 2600 yards wide and five miles long through Marlboro County in 1984. Figure 6 shows the 10 South Carolina counties with the most/least tornadoes.
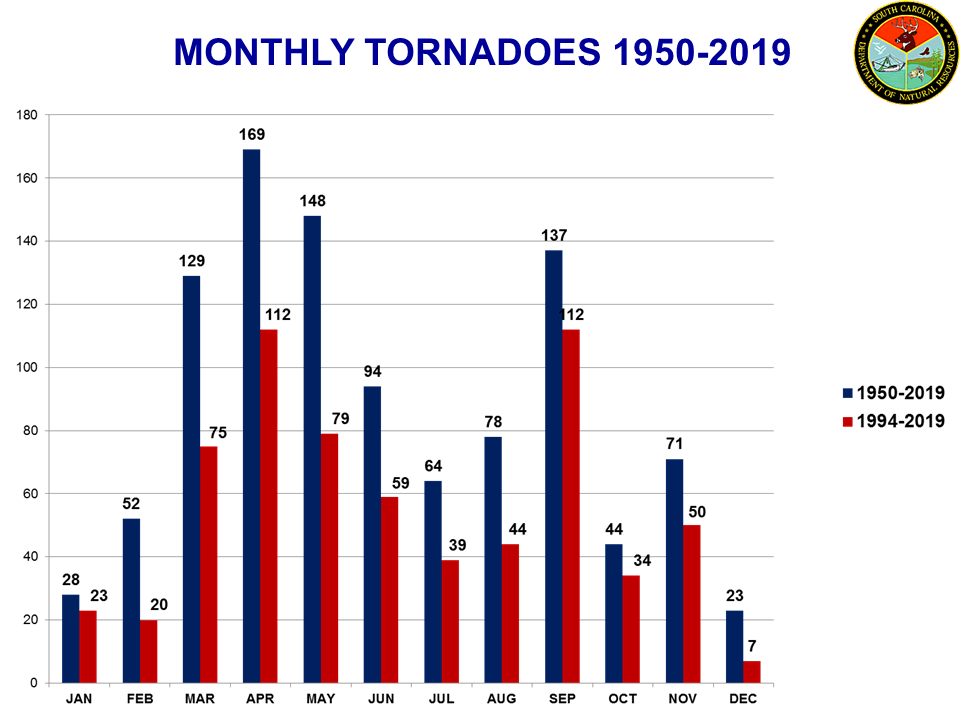
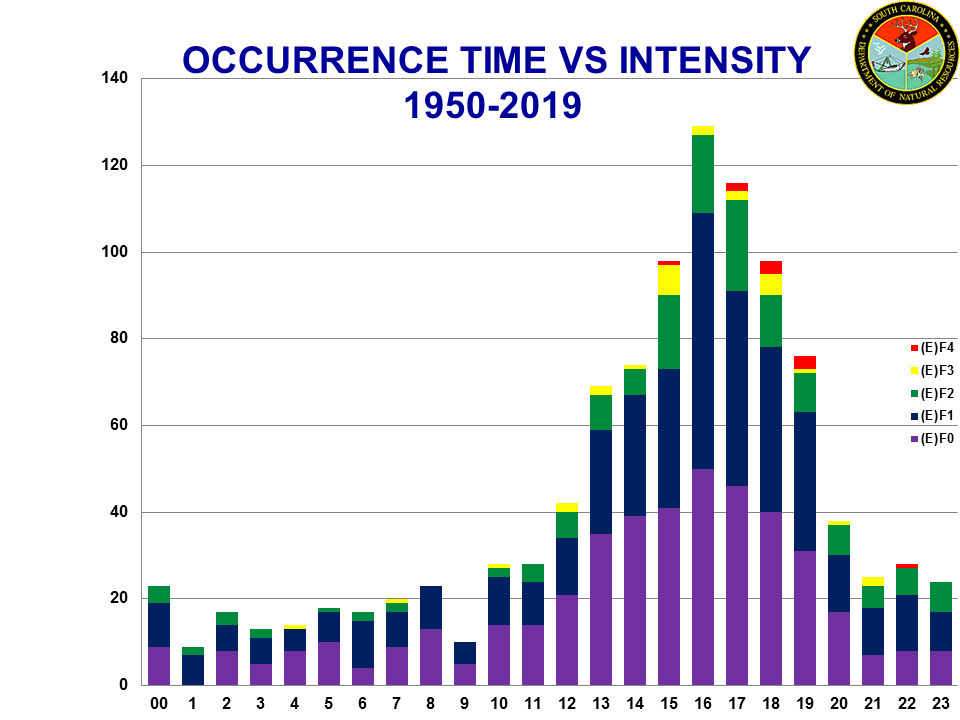
Tornadoes have touched down in South Carolina during every month of the year; however, the most likely months are in the spring, March through May, and later in the fall during September (Figure 7). During spring, tornadoes result from active cold fronts and pre-frontal squall lines. During November and December, it is not uncommon to have active cold fronts and tornadic activity. Tornado frequency reaches a minimum in October and January.
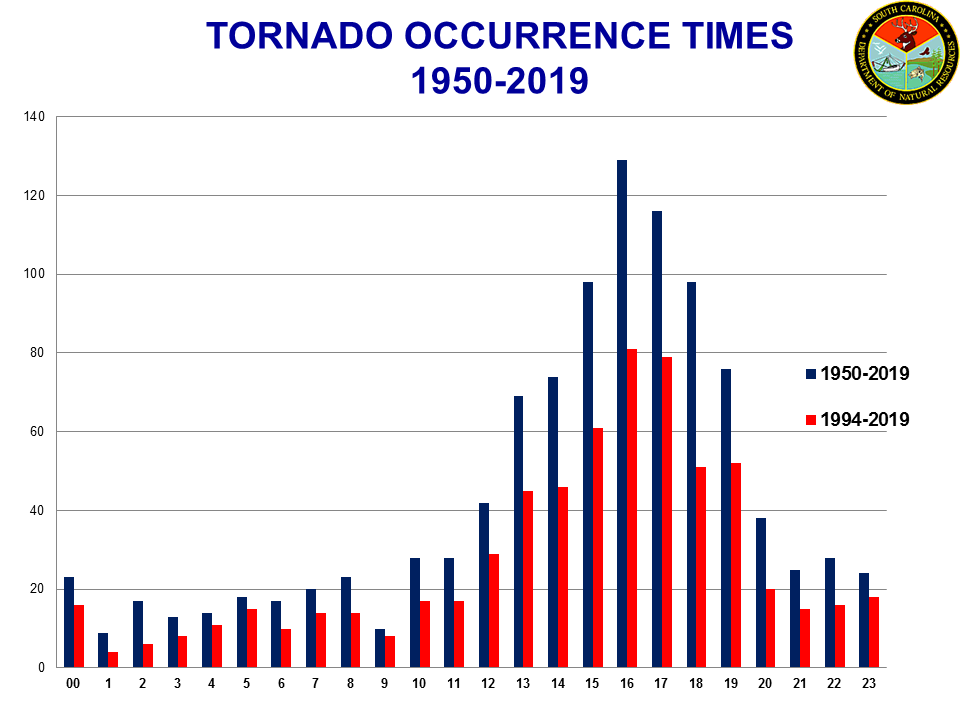
Tornadoes in South Carolina can also touch down at any time during the day or night. Figure 8 shows tornadoes are more likely to touchdown during the afternoon and early evening; but, tornadoes can also touch down late at night and during the early morning hours. These tornadoes are particularly more dangerous because most people are likely asleep and not able to hear television or radio warnings; and, even if awake, you would not be able to see the tornadoes in the darkness. Fortunately, Figure 9 shows that the strongest tornadoes, EF2-4, only occur in the afternoon and early evening when television and radio warnings are most effective.
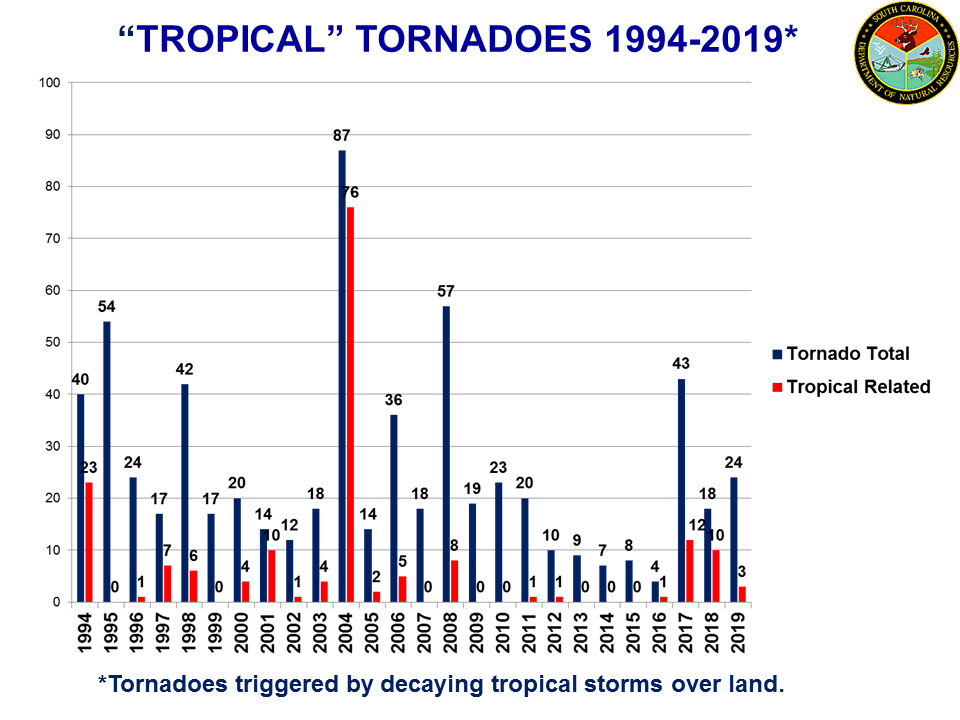
Many late season tornadoes are triggered by decaying tropical storms that make landfall in or near South Carolina. These tropical tornadoes can significantly add to the annual tornado average Figure 10 . Tropical tornadoes tend to be weak, and short-lived; however, Tropical Storm Francis did produce three EF-2 tornadoes and a damaging EF-3 tornado during the record outbreak in September 2004. More on the tropical tornadoes spawned by Francis and other notable tornadoes and tornado outbreaks below:
September 6-7, 2004:Tropical Storm Frances triggered a record 47 tornadoes as it tracked up the spine of the Appalachians. The National Weather Service, using the F0-F5 Fujita scale, identified 26 F0s, 17 F1s, 3 F2s and 1 F3 during the 2-day period. 43 tornadoes touched down on September 7, setting a new one day record. The 47 tornadoes caused widespread damage in the Low Country, Midlands and Pee Dee. Sumter County experienced the worst damage. An F2 destroyed 9 Sumter County homes, damaged 55 homes, injured 3 people and caused over $1.7 million dollars worth of damage. Kershaw County was struck by the F3 tornado which demolished several cinder block stables and deftly picked up a large horse trailer and placed it on the roof of another stable. This record setting tornado outbreak injured 13 and inflicted $2.77 million in total state-wide damages.
August 16, 1994: An outbreak of 22 confirmed tornadoes occurred when the remnants of Tropical Storm Beryl merged with a cold front. The tornadoes damaged homes and buildings in a very narrow band running north from Bamberg County through Lancaster and York Counties. One tornado hit Lexington's central business district. There were no deaths, at least 40 injuries, and over $50 million in damage.
March 28, 1984: The second highest loss of life from tornadoes occurred when 11 tornadoes touched down along a narrow band that extended from Anderson County through Marlboro County. These tornadoes caused 15 deaths, 448 injuries, and damage of over $100 million. These tornadoes also caused several other storm related fatalities.
September 29, 1938: Five tornadoes struck Charleston and the surrounding areas on the morning of September 29, 1938, killing 32 and injuring 150 people. Property loss was estimated to be at least $2,000,000 and it is considered the greatest loss of life and property from tornadoes in that area since the 1886 earthquake. Out of the five tornadoes, the second and third were the most destructive striking the city directly and leaving a parallel path of destruction over 2 miles long. St. Michael's Church, City Hall, St. Phillip's Church and the Old City Market are some of the historic structures that were damaged during this event. The tornadoes were spawned as a result of a cyclone traveling up the coast.
April 30, 1924: The highest tornado death toll in South Carolina's history occurred on this date when two tornadoes struck. The paths of both were unusually long; each over 100 miles long. Together they killed 77 persons, injured 778 more, destroyed 465 homes and many other buildings resulting in many millions of dollars of damage. One tornado remained on the ground from Anderson County to York County; the other, which as been named "The Horrell Hill Tornado", was the more destructive of the two. Its path was 135 miles from Aiken County to Florence County.
Tropical cyclones affect the South Carolina coast on an infrequent basis, but do provide significant influence annually through enhanced rainfall inland during the summer and fall months. Depending on the storm's intensity and proximity to the coast, tropical systems can be disastrous. The major coastal impacts from tropical cyclones are storm surge, winds, precipitation, and tornadoes. Hurricanes are the most intense warm season coastal storms and are characterized by wind speeds exceeding 64 knots (74 miles per hour) and central pressure usually lass than 980 millibars (mb) (28.94 inches of mercury). Less intense, but more frequent, are tropical storms (winds over 34 knots and under 64 knots: greater than 980 mb central pressure) and tropical depressions (winds under 34 knots).
Hurricane Hugo: Hugo crossed into South Carolina coast near the Isle of Palms on September 22, 1989. Surface winds were recorded at 138 miles per hour, with gusts of 160+ miles per hour. The National Weather Service at Charleston recorded a minimum barometric pressure of 27.85 inches. Damage to coastal and inland properties, utilities, agriculture, timber and commerce exceed $6 billion. 50-70,000 people were left homeless and 26 people were killed.
Hurricane Gracie: On September 29, 1959, Gracie made landfall between Charleston and Savannah, Georgia. Winds reached 140 mph and tides reached 8 ft. Damage was estimated at $20 million (1959 dollars), and seven lives were lost.
Hurricane Hazel: Hazel caused $27 million (1954 dollars) in damage on October 14, 1954 after moving parallel to the coast and making landfall near Little River South Carolina. Winds reached 106 mph and tides greater than 16 feet at Myrtle Beach. The heaviest damage in South Carolina was from Pawleys Island northward.
August 27, 1893 Hurricane: This unnamed storm was the most deadly hurricane in South Carolina's history. This storm struck near Savannah, Georgia causing extensive flooding along the lower South Carolina coast. Winds of 120 miles per hour were measured at Charleston and Beaufort. More than 2,000 people drowned and damage estimates exceed $10 million (1893 dollars).
The state has high interannual and seasonal variabilities of precipitation. The main cause of this is the strength and geographic placement of Bermuda high. As the high pressure continues its grip over the area, solar radiation increases, which in turn increases the temperature, which then decreases the cloud cover, thereby reducing the probability of substantial precipitation.
Droughts are sometimes alleviated by a tropical cyclone. In 1954, Hurricane Hazel ended an extreme drought in eastern South Carolina, although drought conditions continued in western sections. In 1990, the remnants of Hurricane Klaus and Tropical Storm Marco ended an extreme drought.
Precipitation occurs during periods of drought, however, it is highly localized, inconsequential, and generally evaporates within 24-hours after falling. Periods of insufficient rainfall for crop growth occur during some summers. There is approximately a one in four probability of a drought somewhere in South Carolina at any time (Guttman and Plantico, 1987). Field crops such as corn, cotton, and soybeans are greatly stressed when drought conditions extend over several weeks during the growing season because only 9% of all farms in the state have irrigated acres, as compared to 26% nationwide. However, the state has a similar proportion of irrigated acres when compared to Alabama, North Carolina, and Virginia. Only Florida and Georgia have higher percentages of irrigated land in the Southeast United States (U.S. Department of Commerce, 1993).
Historically, droughts have had severe adverse impacts on the people and economy of South Carolina. Periods of dry weather have occurred in each decade since 1818 (National Water Summary 1988-1989 Hydrologic Events and Floods and Droughts, 1991). The earliest records of drought indicate that some streams in South Carolina went dry in 1818, and fish in smaller streams died from lack of water in 1848. The most damaging droughts in recent history occurred in 1954, 1986, and 1998-2002. Less severe droughts were reported in 1988, 1990, 1993, and 1995. The adverse impacts on the people and economy were made especially clear during the drought of 1998-2002 that impacted agriculture, forestry, tourism, power generation, public water supplies, and fresh water fisheries.
Intense coastal storms normally occur during the fall through early spring. Their affects range from high winds and tides along the beaches to rain and occasional snowfall Upstate. The storm system of January 1, 1987, with its gale force winds and abnormally high tides, caused an estimated $25 million worth of damage to South Carolina beach front properties.
The lowest pressure ever recorded at Columbia occurred on March 13, 1993 during an intense winter cyclone. The cold weather that accompanied this storm resulted in two deaths, one on the 13th, and one on the 15th. In addition to the cold, it dumped 1.5 feet of snow in the Mountains, flurries in the Lowcountry, and caused an estimated $22 million worth of total damage to the state.
Flooding occurs on several streams in the state each year. A certain amount of control can be effected on the large rivers which have dams. The state can experience riverine flooding any month of the year. However, it is most likely to occur in association with tropical cyclones, because of their typically slow forward motion and abundant moisture.
September 16, 1999: The remnants of Hurricane Floyd dumped up 15"-20" of rain along the coast triggering wide spread flooding along the South Carolina Coast. The heavy rains caused record flooding of the Waccamaw River. Over 1700 homes were damaged in Horry County. Three foot flood waters were reported in the vicinity of Murrell's Inlet. No flood related injuries were reported.
October 10-13, and October 22, 1990: . The former was a result of the remnants of Hurricane Klaus and Tropical Storm Marco moving northwards along a stationary front. This flood caused 4 deaths in Kershaw County, when a dam burst sending water across a road trapping the people in their vehicle. Another death occurred in Spartanburg County, when a toddler drowned in a rain-swollen creek. As a result of the flooding, Aiken, Calhoun, Cherokee, Darlington, Edgefield, Florence, Kershaw, Lee, Orangeburg, Spartanburg, Sumter, and Union counties were declared federal disaster areas.
August 1908: The most extensive flooding in South Carolina history occurred on this date. All the major rivers of the state rose from 9 to 22 feet above flood stage.
Excessive amounts of rain was received in the extreme eastern counties and in all of the northern and western counties. Reporting locations recorded two to four times the normal amount of rainfall, most which fell from the 23rd to the 26th, causing floods in all the streams and rivers of the upper and central portions. The floodwaters rose to greater heights and the floods were more destructive, and the money value of the damage was greater than ever before known, authentic records being available for comparison since 1840.
The greatest twenty-four hour rainfall was 11.65 inches, at Anderson, on the 24th-25th. On the 24th-26th, Anderson had 14.31 inches in 34 hours, at Blairs on the 24th-26th had in 60 hours; at Calhoun Falls on the 23rd-26th, 9.62 inches in 63 hours, at Camden on the 25th-26th, at Catawba on the 23rd-26th, 10.12 inches in 65 hours; at Cheraw on the 24th-26th, 6.52 inches in 62 hours, at Clemson College on the 25th, 2.81 inches in 24 hours, at Conway on the 26th, 2.83 inches in 14 hours, at Greenville on the 23rd-26th, 16.94 inches in 78 hours, at Greenwood on the 24th-26th, 7.06 inches in 60 hours, at Liberty on the 24-25th, 11.12 inches in 24 hours, at Mt Holly in N.C on the 23rd-26th, 11.19 inches in 58 hours, at Pelzer on the 24th-26th, 5.14 inches in 27 hours, at Santee on the 23-25th, 10.83 inches in 58 hours, at Spartanburg on the 24th-26th, 9.33 inches in 72 hours, at Ferguson on the 26th, 2.59 inches in 24 hours; at Winnsboro on the 24th-25th, 7.85 inches in 48 hours, at Winthrop College on the 24th-25th, 7.10 inches in 48 hours.
Thunderstorms occurred on 21 days during the August of 1908. The periods of maximum frequency were the 2d, 5th, 6th, 8th, 16th, 19th, 21st, 23rd-26th, when from five to eleven of the fifteen stations that recorded thunderstorms reported their occurrence.
June 1903: The highest number of people killed by floodwaters in South Carolina occurred on the Pacolet River, a tributary of the Broad River, when 60 to 80 people drowned in a flash flood.
The Flood of 1903:Terror Along the Pacolet River from Textile Town:Spartanburg County South Carolina, Hub City Writers Project, 2002. pp. 77-81. Reprinted from The Great Freshet of 1903: A Morning of Terror Along the Pacolet River, by William M. Branham, Sandlapper Feb. 1980, pp. 8-12.
Selected pictures from Seeing Spartanburg: A history in images by Philip Racine, Hub City Writers Project 1999.
Day of Disaster from A Place Called Clifton, by Michael Hembree and David Moore, Jacobs Press 1987, pp.78-95.
Lost in the Sand from Clifton A River of Memories, by Michael Hembree and David Moore, Jacobs Press 1988, pp.168-173.
From Spartanburg Almanac compiled by Wofford College Professors J.A. Gamewell and D.D. Wallace, published by W.F. Barnes, Spartanburg, 1904, pp. 7-15.
It Can and Has Happened in South Carolina, from The State Magazine, October 2, 1955.
Destructive Floods in the United States in 1903, by E.C. Murphy. Water-Supply and Irrigation Paper No. 96; Series M, General Hydrographic Investigations, 11; United States Geological Survey, Department of the Interior. Government Printing Office, Washington, D.C. 1904, pp 9-20.
The Mountains have a strong influence on the prevailing surface wind direction. On a monthly basis, prevailing winds tend to be either from the northeast or southwest. Winds from all directions occur throughout the state during the year, but the prevailing directions by season are:
| Season | Direction | Degrees |
|---|---|---|
| Spring | Southwest | 210 to 240 |
| Summer | South and Southwest | 170 to 250 |
| Autumn | Northeast | 20 to 60 |
| Winter | Northeast and Southwest | 20 to 60 |
Average surface wind speeds for all months range between 6 and 10 miles per hour. Upper air winds (more than 1500 meters above mean sea level) are usually southwest to northwest in winter and spring, south to southwest in summer, and southwest to west in autumn. The mountains control wind direction during all seasons, but have a more pronounced effect in the winter, summer, and autumn.
During winter, most cyclones that affect the state pass to the south of the Mountains. As these systems move around the Mountains, the winds are generally southwest. As the cyclone moves over the Atlantic Ocean, the winds shift to the northeast. During summer, air flows north along the western edge of the Bermuda High, from the Gulf of Mexico. Quite often the Mountains form the western extent of the Bermuda High.
During autumn, winds are northeast because the mountains form the southern edge of the pre-dominant continental high pressure pattern known as a "wedge". This type of weather system moves southward along the eastern seaboard, with a center of circulation over New England. This circulation fosters northeast winds as the air wraps about the center in a clockwise fashion.
The Bermuda High also contributes to air stagnation, especially during the summer. During the period 1936-75, it was shown that the state experienced between 20 stagnation days per year in the Coastal Plain and more than 28 stagnation days per year occurred in the Central Savannah River area. The winds in stagnant air are very light, and tend to be rather disorganized in direction (Aneja and Yoder, 1992).
Pan evaporation measurements are available for selected sites across the state. These observations may be expressed in the number of inches of water per dry day, per month, or per year, from an evaporation pan. The evaporation pan is accurately leveled at a site which is nearly flat, well-sodded, and free from obstructions. The pan is filled with water to a depth of eight inches, and daily measurements are made of the changes in water level.
Map 2 depicts the average annual pan evaporation. Average annual pan evaporation observations show considerable variation across the state. The largest annual evaporation, more than 65 inches, is found in the Lowcountry. There is, however, a second area of more than 60 inches that extends across the Midlands. Moving northwest across the state, pan evaporation measurements decrease with annual values of less than 40 inches in the higher elevations of the Upstate. The only significant anomaly to the above are the Clark Hill observations which are lower than nearby areas, due to its close proximity to a large lake.
Aneja, Viney P. and G. Yoder. Characterization of Ozone Climatology in the Southeastern United States and Climate Change. Research Paper #010192, Southeast Regional Climate Center, Columbia, SC 1992.
Austin, Hal. The Horrell Hill Tornado, April 30, 1924. Research Paper #032393, Southeast Regional Climate Center, Columbia, South Carolina, 1993.
Changnon, David, J.H. Jacobson, and D.J. Smith. Analysis of the October 10-13, 1990, Heavy Rains and Their Impacts on the Southeast. Research Report #101591, Southeast Regional Climate Center, Columbia, South Carolina, 1991.
Coffey, James R. South Carolina Crop-Hail Risk Patterns: A Geographic Analysis. Unpublished Master's Thesis, University of South Carolina, Department of Geography, Columbia, South Carolina, 1988.
Davis, Robert E. and D.A. Gay. Freezing Rain and Sleet Climatology of the Southeastern U.S.A. Research Paper #052593, Southeast Regional Climate Center, Columbia, South Carolina, 1993.
Guttman, Nathaniel and M. Plantico. "Drought History and Chance of Recurrence" in Climate Report G-30: Southeast Drought Symposium Proceedings, March 4-5, 1987 (Scott F. Sidlow, Editor) South Carolina Department of Natural Resources Water Resources Division (Formerly South Carolina Water Resources Commission), Columbia, South Carolina, 1987.
Knupp, Kevin R. Climatology of Severe Weather Events for the Southeastern United States. Research Paper #040192, Southeast Regional Climate Center, Columbia, South Carolina, 1992.
Kronberg, Nathan and J.C. Purvis. Climates of the States: South Carolina, in Climatography of the States, United States Department of Commerce, Washington, District of Columbia, 1959.
Landers, H. The Climate of South Carolina, in Climates of the States, Volume 1, Water Information Center, Inc., Port Washington, New York, 1974.
List, Robert J. Smithsonian Meteorological Tables, Sixth Revised Edition. Smithsonian Institution Press, Washington, District of Columbia, 1984.
Purvis, John C. Climate Report G-2: South Carolina Tornado Statistics: 1950-82. South Carolina Department of Natural Resources Water Resources Division (Formerly South Carolina Water Resources Commission), Columbia, South Carolina, In Preparation.
Purvis, John C. South Carolina Pan Evaporation. South Carolina Department of Natural Resources Water Resources Division (Formerly South Carolina Water Resources Commission), Columbia, South Carolina, In Preparation.
Purvis, John C.,W. Tyler, S.F. Sidlow. Climate Report G-26: Hurricanes Affecting South Carolina. South Carolina Department of Natural Resources Water Resources Division (Formerly South Carolina Water Resources Commission), Columbia, South Carolina, 1986.
Purvis, John C.,S.F. Sidlow, D.J. Smith, I. Turner, W. Tyler. Research Report No. 2, South Carolina Tornado Statistics, 1912-1989. Southeast Regional Climate Center, Columbia, South Carolina, 1990.
Purvis, John C.,W. Tyler, S.F. Sidlow. Climate Report G-5: General Characteristics of South Carolina's Climate. South Carolina Department of Natural Resources Water Resources Division (Formerly South Carolina Water Resources Commission), Columbia, South Carolina, 1990.
Sidlow, Scott F., W. Tyler. Climate Report G-31: South Carolina Sunrise and Sunset Tables and Sun Path Diagrams. South Carolina Department of Natural Resources Water Resources Division (Formerly South Carolina Water Resources Commission), Columbia, South Carolina, 1990.
Smith, David J. Climate Report G-18: Hurricane Risk Hilton Head, South Carolina. South Carolina Department of Natural Resources, Columbia, South Carolina, 1994.
Snyder, H. Stephen, S.J. deKozlowski, T.W. Greaney, J.A. Harrigan, M.K. Haralson, H.T. Shaw, G.E. Siple, F.L. Collins, D.L. Miller. South Carolina State Water Assessment, Report No. 140. South Carolina Department of Natural Resources Water Resources Division (Formerly South Carolina Water Resources Commission), Columbia, South Carolina, 1983.
Trewartha, Glenn T. and L.H. Horn. An Introduction to Climate, Fifth Edition. McGraw-Hill Book Company, New York, New York, 1980.
Trewartha, Glenn T. The Earth's Problem Climates, Second Edition. University of Wisconsin Press, Madison, Wisconsin, 1981.
Turner, Ian, J.C. Purvis, W. Tyler, S.F. Sidlow. Climate Report G-37: Hurricane Hugo 1989. South Carolina Department of Natural Resources Water Resources Division (Formerly South Carolina Water Resources Commission), Columbia, South Carolina, 1990.
United States Department of Commerce. 1961-1990 Normal Temperature and Precipitation. National Climatic Data Center, Asheville, North Carolina, 1992.
United States Department of Commerce. Storm Data, October 1990, 32:10. National Climatic Data Center, Asheville, North Carolina, 1990.
United States Department of Commerce. Storm Data, March 1993, 35:3. National Climatic Data Center, Asheville, North Carolina, 1993.
United States Department of Commerce. 1992 Census of Agriculture, 1:51 United States Summary and State Data. Bureau of the Census, Washington D.C., 1993.
United States Department of War. Monthly Weather Review, XVIII:5. United States Army Signal Corps, Washington, District of Columbia, 1890.
