Spotted Seatrout Population Structure
Spotted seatrout, Cynoscion nebulosus, is a highly targeted fish by recreational anglers in South Carolina, second only to red drum. Spotted seatrout are found throughout the Gulf of Mexico and the western Atlantic as far north as Cape Cod, Massachusetts; however, in the Atlantic, they are most common in the southeast U.S. from North Carolina to Florida. Spotted seatrout typically spend their entire lives living in estuaries. Estuaries are highly productive habitats for fish and invertebrates, but these animals are subjected to seasonal and tidal fluctuations in many physical factors including temperature, salinity, and dissolved oxygen. Spotted seatrout, along with most estuarine organisms, have adapted to these fluctuations in their daily lives, but are vulnerable to cold winters in SC when the water temperatures drop well below average. The cold-temperature tolerance of spotted seatrout is currently being determined in ongoing research at SCDNR’s Marine Resources Research Institute (MRRI).
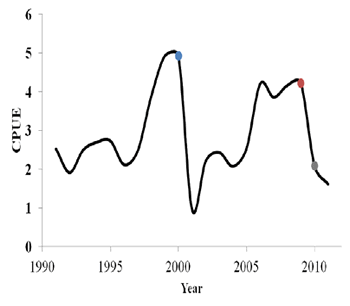
South Carolina has experienced three cold winters over the past decade in 2000, 2009, and 2010. During these years, water temperatures dropped well below average and resulted in substantial decreases in spotted seatrout populations across the entire state (Fig. 1). SCDNR is tasked with monitoring recreational fisheries and making management decisions to keep the population healthy. Researchers at MRRI are currently evaluating stock enhancement of spotted seatrout as a management tool, in addition to creel limits and size restrictions or even temporary closures in an emergency. SCDNR follows a responsible approach to marine stock enhancement, which means before fish are stocked into any system we ensure that they are behaviorally, morphologically, physiologically, and genetically similar to wild populations. One of the first and most important steps before establishing a stock enhancement program is determining the genetic structure of the wild fish population.
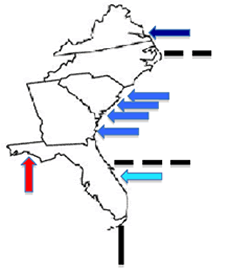
In 1996, SCDNR investigated the population structure of spotted seatrout in the Gulf of Mexico and Southeast Atlantic and found that these groups of fish were genetically different from each other. In addition we found that along the Atlantic coast seatrout population were genetically different from each other and it was thought that these differences occurred around Cape Hatteras, NC and Cape Canaveral, FL (Fig. 2). Today we are using better genetic tools at the Hollings Marine Laboratory that allow us to look at finer scale differences along the coast. In the present study, we collected samples ranging from NC to GA with collaboration from the NC Division of Marine Fisheries, SCDNR, and GADNR. We looked at the similarities and differences in the seatrout DNA to determine how closely related fish from each estuary are to each other.
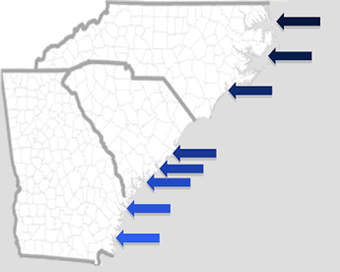
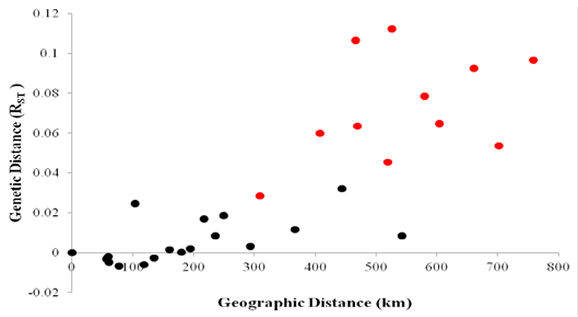
The findings of the present study suggest that the populations gradually change from estuary to estuary along the coast. This gradual change reinforces our belief that spotted sea trout don’t typically move great distances up and down the coast, but rather stay in one estuary their entire life. The gradual differences we see are likely due to small-scale dispersal of spotted seatrout larvae or adults to adjacent estuaries where mixing occurs. There are still real differences between NC and SC/GA (Fig. 3). Spotted seatrout populations show significant genetic divergence with separation of ~200 km because individuals are moving short distances, a pattern termed “isolation by distance” (Fig. 4). An isolation by distance pattern creates the significantly different genetic groups of spotted seatrout found in NC versus SC-GA. This means that spotted sea trout might be adapting to specific estuaries that have unique conditions. While these genetic differences aren’t great between any two adjacent estuaries, the results still suggest that stocking of fish should be confined to the locality of where the adult spawners were collected in order to preserve the current population structure.
In addition to this population structure research, we are investigating the impacts that winter fish kills may have on genetic diversity within local seatrout populations. Populations with sufficient genetic diversity are better able to adapt and rebound from changes to their environment. Understanding how increases and decreases in seatrout abundance affects diversity will allow fisheries managers to make better informed decisions to maintain a healthy fishery.


